

KEY POINTS
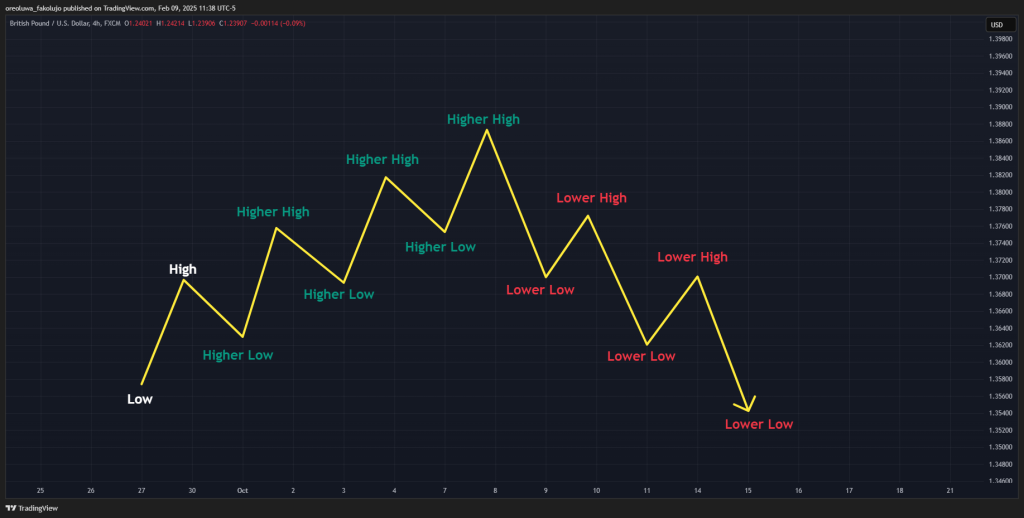
- Market structure forms the basis of every trend on the trading chart, and it consists of the higher high, higher low, lower low, and lower high
- A sequence of higher low and higher high make an uptrend and a sequence of lower high and lower low make a downtrend.
- Market structure is so important for every trader, as many other technical analysis strategies have it as their foundation
There are many ways to know when the market is trending (or when it isn’t). You could use technical indicators, such as the Moving Average and the RSI. You could also use chart drawing tools like the trendline to tell the trend. But there’s another way that doesn’t require tools or any drawings. You can spot trends with your naked eyes with this method. Many people call it the market structure, and it consists of the higher high, higher low, lower high, and lower low.
In this piece, we’ll show you how to recognize trends using the market structure of higher highs, higher lows, lower highs, and lower lows. We’ll also show you how to use them in your trading with a trading example.
Table of Contents
What are Highs and Lows in Trading?
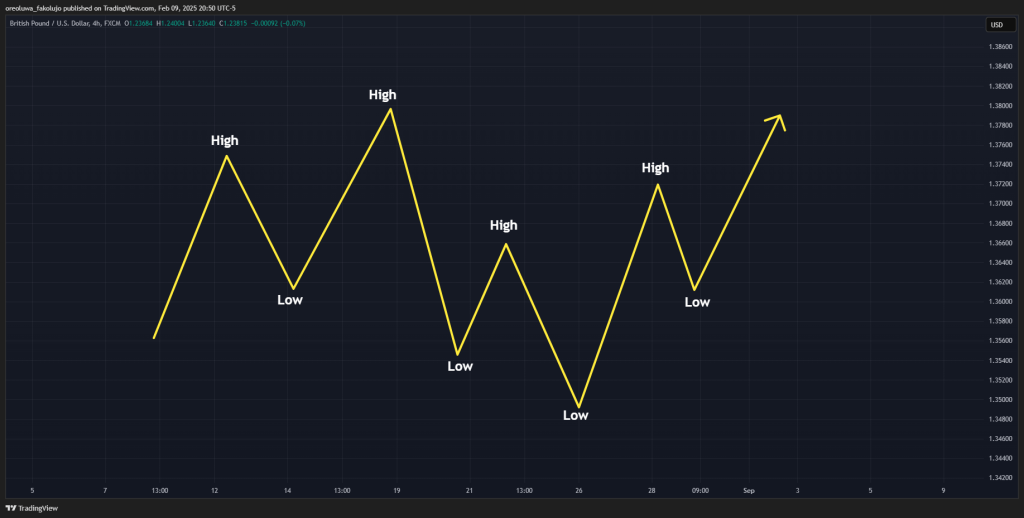
Before we discuss higher or lower highs and lows, we must first understand what highs and lows are. These two concepts are the key to unlocking everything else.
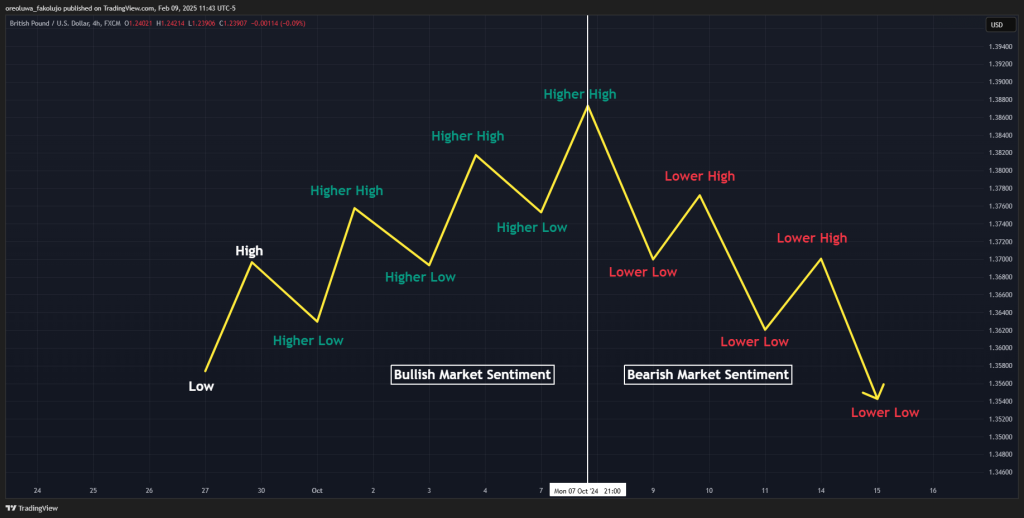
A high is formed on the financial market chart when the price reaches a new peak before pulling back. Similarly, a low is formed on the trading chart when the price reaches a new trough before pulling back. When you open any trading chart, notice the up and down movement of the price, even when the market is moving in one ultimate direction. The turning points of those up and down movements are the highs and lows.
The sequence in which these highs and lows appear is called the market structure, and it helps determine market sentiment. There are two major types: bullish market structure and bearish market structure.
The Bullish Market Structure: Higher High and Higher Low
A higher-high is when we have two successive highs where the new high surpasses the preceding high. To explain a little further, we have a previous high, after which the price pulls back. If the next high immediately after that first high surpasses the first high, we consider this a higher high.
The higher low is a series of two lows in which the second low doesn’t dip as far as the preceding low. When this happens, it’s a sign that the selling pressure is weakening.
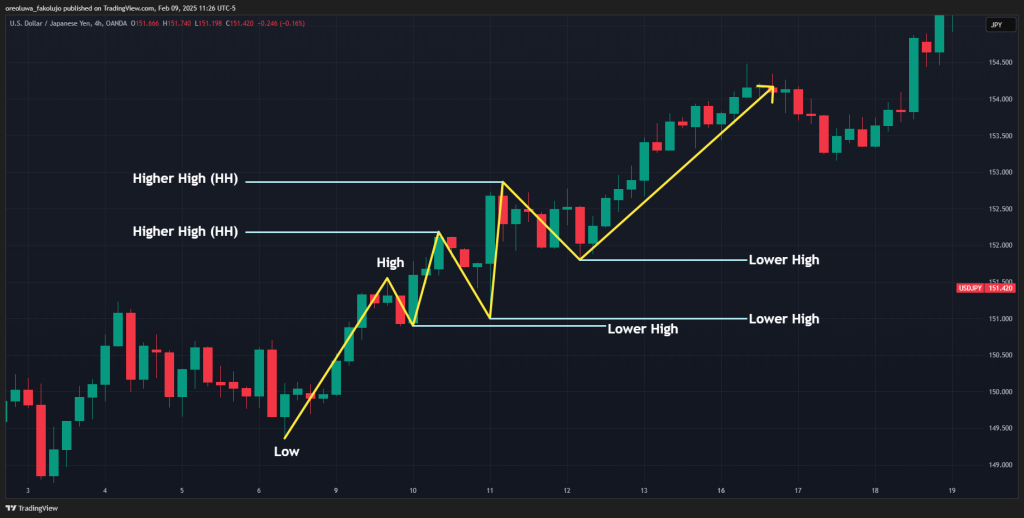
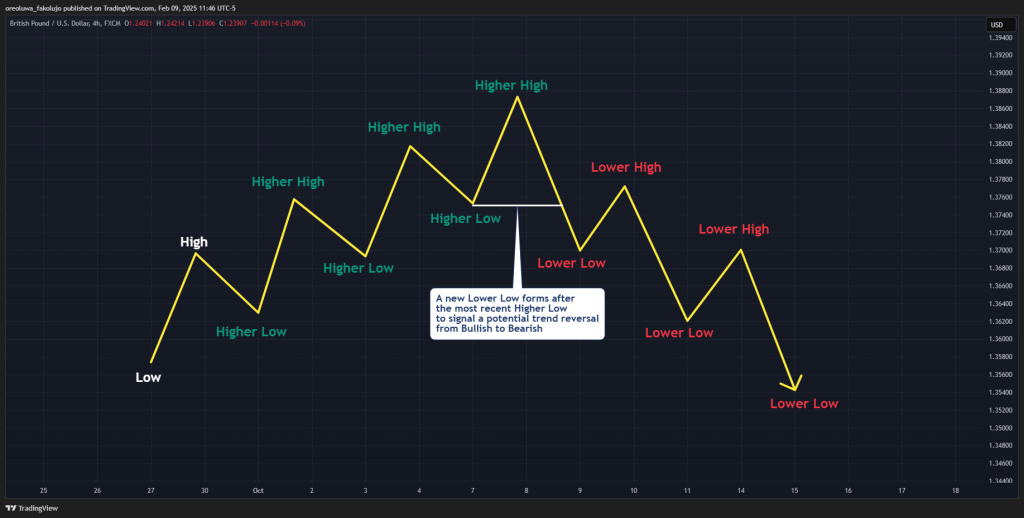
A procession of higher highs and higher lows indicates a bullish trend, which is why this procession is called the bullish market structure. However, the early sign of bearishness is when a low falls below the most recent higher low. In other words, we get a lower low.
As far as preserving an uptrend is concerned, the higher low is more important than the higher high. Why? It is possible that we won’t get a higher high after a higher low, and the trend will still be an uptrend. However, the moment we have a new low forming a lower low, the uptrend becomes invalid until we have a new higher high.
The Bearish Market Structure: Lower High and Lower Low
A lower high is a sequence of two highs where the second high doesn’t surpass the preceding high. Lower highs are characteristic of a bearish market, where the strength of the bulls is diminishing.
The lower low occurs when the second low in a sequence of two lows dips further than the first low. This is a sign that the buying pressure is weakening.
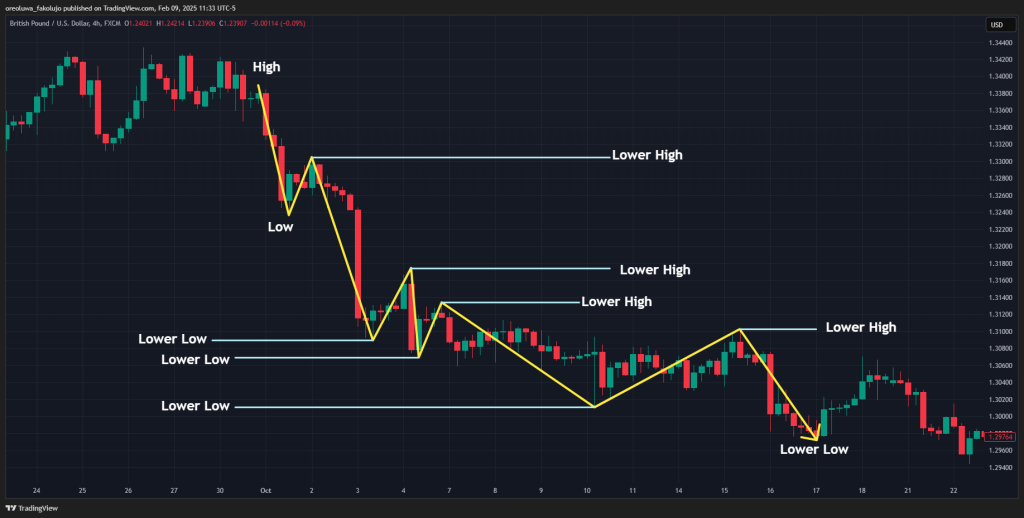
When we have a sequence of lower highs and lower lows, this is a sign that the sentiment is bearish. We say we have a bearish structure. However, the first sign of trouble for the bears is when we get a new high that surpasses the most recent lower high to form a higher high.
Just as with the bullish market structure, the lower high is more reliable than the low when it comes to preserving the downtrend. The reason is that the moment we get a new high that surpasses the most recent lower high, the downtrend is in danger of becoming bullish. But if we have a new low that doesn’t break the most recent lower low (a new higher low) while the most recent lower high is still intact, the downtrend remains valid.
How Do You Identify Trends with Market Structure?
Identifying trends with higher highs and lows and lower highs and lows is quite simple. Let’s show you:
1. Mark Out the Highs and lows
Your first goal is to start from the most recent price and mark out the last six highs and lows. For novice traders who haven’t already determined what counts as a high or a low, this can be quite a challenging task. While this is something practice can solve, you can use the zig-zag indicator to determine trends in the meantime. Tweak the settings in the indicator until you have a trend marking you’re most comfortable with.
2. Observe the Sequence of successive lows and highs
After marking out the highs and lows, try to see if you have a sequence of at least two consecutive lower highs or higher lows. Two successive higher lows mean the trend is bullish. And two successive lower highs mean the trend is bearish.
In an ideal trending situation, higher highs should accompany higher lows in an uptrend, and lower lows should accompany lower highs in a downtrend. However, a trend without a higher high and lower low can still be bullish or bearish. Your discretionary judgment will play a huge role in determining the trend in this situation.
For more aggressive trend identification, you only need to see a higher low and a higher high for an uptrend. And for a downtrend, you only need to see a lower high and a lower low.
How Do You Use Market Structure in Trading?
Let’s get to where the rubber meets the road with higher highs and lows and lower highs and lows.
1. Market Trend or Sentiment
The primary way to use these concepts is to tell the market sentiment. When we have a series of at least two higher highs and higher lows, this is a sign that we’re in a strong uptrend. But when we are in a series of minimum of two lower highs and lower lows, we’re in a strong downtrend.
Also, if you see a seemingly random mix of lows and highs that don’t have the order we just mentioned, the market is likely in consolidation.
Once you know the trend, you only need to find a way to enter in the direction of the trend. We’ll show you an example of how to do this in the next section. But first, how else can you use the higher highs and lows and lower highs and lows?
2. Early Signs of Reversal
Traders are always trying to catch new trends right at the beginning, and market structure could be a tool that helps you achieve that.
Whenever we break an uptrend sequence (higher highs and higher lows) so that we have a new low that dips below the most recent higher low, that is the first sign that the bears are taking over the bulls.
In a similar fashion, if we’re in a bearish trend with a sequence of lower lows and lower highs, and we get a new high that takes out the most recent lower high, the downtrend is likely reversing to an uptrend.
By the way, this is a slightly more technical way to use the market structure, as you may expose yourself to inducements and false price movements. Catching reversals requires more trading skills than following the prevailing trend. So, be cautious when trying to catch reversals.
How to Trade Higher Highs and Lows and Lower Highs and Lows
The trading method we’ll be sharing here is how to trade in the direction of the trend. We’ll also be using the GBPUSD chart on the 4-hour timeframe as our case study.
Trade Setup
We first need to confirm the trend by spotting at least two successive higher lows or lower highs.
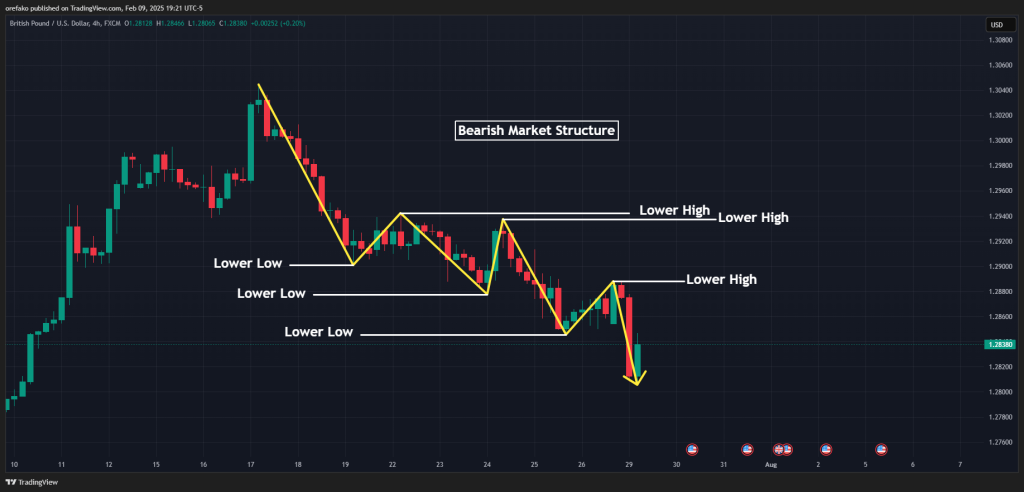
In our trading example, we’re in a downtrend because we have a series of lower highs and lower lows.
Trade Entry
Your next task is to wait for the next pullback after the most recent higher high in an uptrend or the pullback after the most recent lower low in a downtrend. This pullback is your cue to get in, and there are many ways to do this. You could use the Fibonacci Retracement tool or the ICT Optimal Trade Entry.
If you want to follow the Smart Money Concept, enter the demand or supply zone that the price is pulling into. You could even use concepts like the Fair Value Gaps and order blocks.
There are just so many ways to go about this. However, we’ll be keeping things simple for the sake of our trading example. We’ll use a simple Fibonacci Retracement entry.
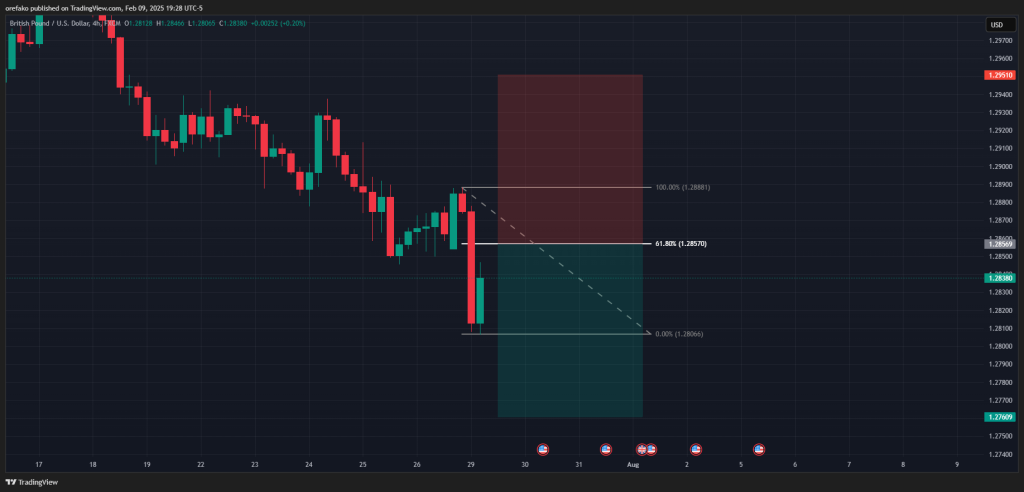
So, we wait for the price to retrace to the 61.8% Fibonacci level. We place our limit order there in anticipation of the pullback to that level.
Risk Management
Ideally, your stop loss will be below the most recent higher low in an uptrend and the most recent lower high in a downtrend.
For your profit, you can target a 1:1.5 risk-to-reward ratio. You can also use the Fibonacci extension tool to set your target. You can even ride the trend for as long as you want, only getting out when we get a shift in market structure to the opposite direction. Be careful with this method, though, as you may be giving a lot of profit back to the market if you don’t know how to manage risk effectively.
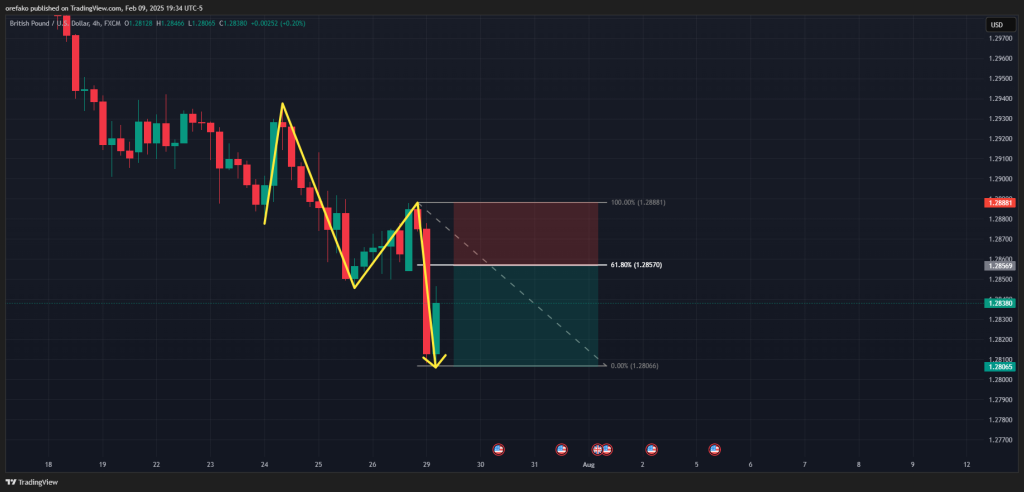
In our example, we place our stop loss at the same level as the most recent lower high and place our profit target at the same level as the most recent potential lower low.
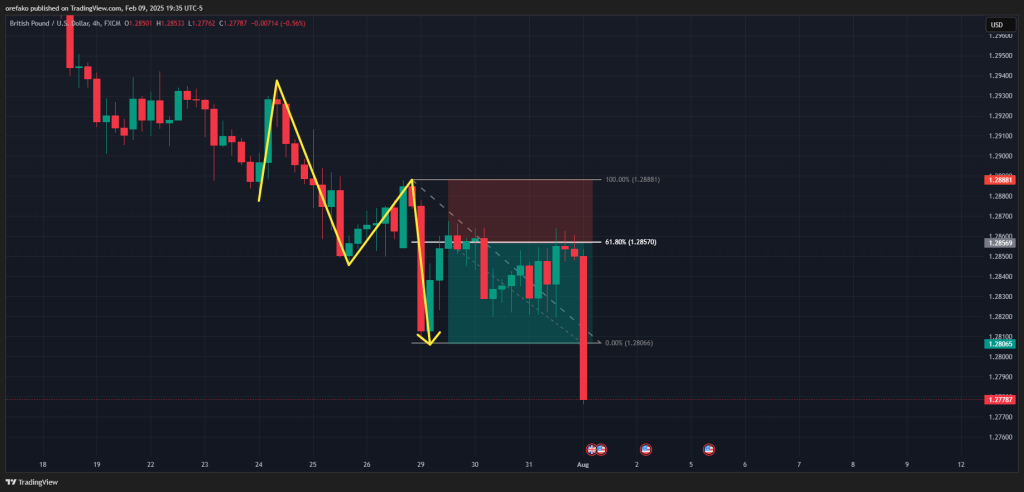
The image above is how the trade ended.
What are the Benefits and Limitations of Trading Higher Highs and Lows or Lower Highs and Lows?
Market structure brings a lot of clarity to the trading world for most traders. However, it’s not all roses with these lows and highs. Let’s see some of the benefits and limitations.
Benefits
The market structure offers you objective ways of viewing the trend. This is especially useful for novice traders who are still learning to identify trends. That’s one.
Secondly, a lot of other trading strategies are built on the concepts of lows and highs. So, when you get good at identifying market structure, you can go on to add any other new piece of information for your forex trading. This alone can improve your trading performance.
Another peculiar benefit is that, unlike indicators and chart drawings, it is easier to spot consolidating price action using lows and highs. When a sequence of lows and highs doesn’t follow the uptrend or downtrend sequence of successive higher lows or lower highs, respectively, the market is likely consolidating.
Limitations
For novice traders who don’t know what counts for highs or lows yet, it can be tricky to mark them out. However, with the use of the Zig Zag indicator this can be easily solved.
While highs and lows help you identify trends, there are times when things are not just clear. In such scenarios, we advise that you use other trading tools to confirm your market bias. Just remember that you don’t always have to be sure about the market’s direction. On days that you aren’t sure, don’t trade. But on days that the direction is clear to you, take advantage.
Final Thoughts
The beauty of the market structure in trading is that many other trading strategies just easily rest on it. You can use it to tell broader market directions on higher timeframes and still use it to get your entry and exit points on the smaller timeframe. It’s one of those technical analysis tools that are fundamental to any price action strategy, and mastering it can help you make informed trading decisions.
