- The UK flash composite PMI which revealed an increase from 52.8 to 53.4 in August.
- The pound has gained 2% in August as the dollar weakened.
- Markets are awaiting Powell’s speech later in the day.
The GBP/USD price analysis shows a solid bullish trend as the pound rallies to new highs after positive UK business activity data. At the same time, the dollar was frail as investors gained confidence in a September Fed cut ahead of Powell’s speech.
-Are you interested in learning about the forex signals telegram group? Click here for details-
On Thursday, the S&P 500 released UK flash composite PMI which revealed an increase from 52.8 to 53.4 in August. Meanwhile, economists had expected a smaller increase to 52.9. The surge in business activity was bullish for the pound, as it indicated a resilient economy, lowering BoE rate cut expectations.
The pound has gained 2% in August as the dollar weakened. Recent US data has raised the likelihood that the Fed will cut rates in September. Inflation is consistently easing towards the 2% target. At the same time, the labor market has shown cracks, putting more pressure on the Fed.
US central bank policymakers came out on Thursday, supporting a September rate cut. This was a clear shift from their previous cautious tone. With one more inflation report to go, the risk of a major shift in the rate-cut outlook has reduced.
Meanwhile, markets are awaiting Powell’s speech later in the day. Experts believe he will echo what other policymakers have said so far. However, investors will focus on his message regarding the size and pace of future rate cuts. A more dovish outlook beyond September might weaken the dollar further, lifting sterling.
GBP/USD key events today
- Fed Chair Powell Speaks
- Jackson Hole Symposium
GBP/USD technical price analysis: Overbought conditions


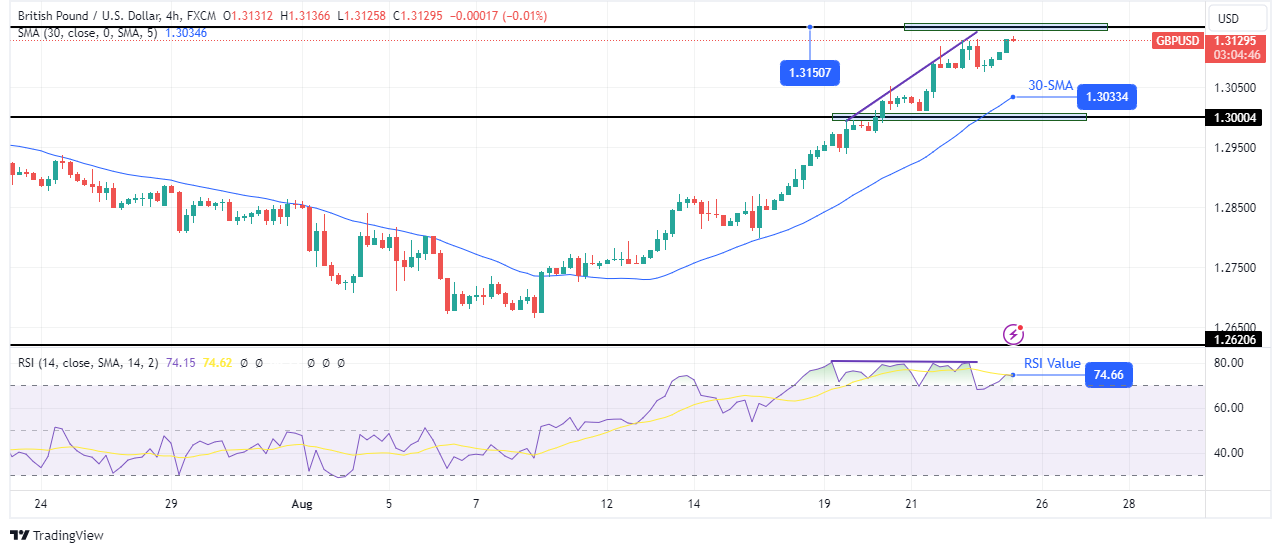
On the technical side, the GBP/USD price is approaching the 1.3150 key level. The bullish bias is strong because the price has traded above the 30-SMA for a long time without pulling back. At the same time, the RSI has traded in the overbought region as bulls maintained massive momentum.
-If you are interested in forex day trading then have a read of our guide to getting started-
However, as the price made new highs, the RSI has traded sideways, showing bulls have reached the limit. Therefore, bears may be ready to push the price lower and retest the 30-SMA support. Nevertheless, bulls might touch 1.3150 before temporarily giving up control.
Looking to trade forex now? Invest at eToro!
67% of retail investor accounts lose money when trading CFDs with this provider. You should consider whether you can afford to take the high risk of losing your money.


