FTSE 100 extends gains
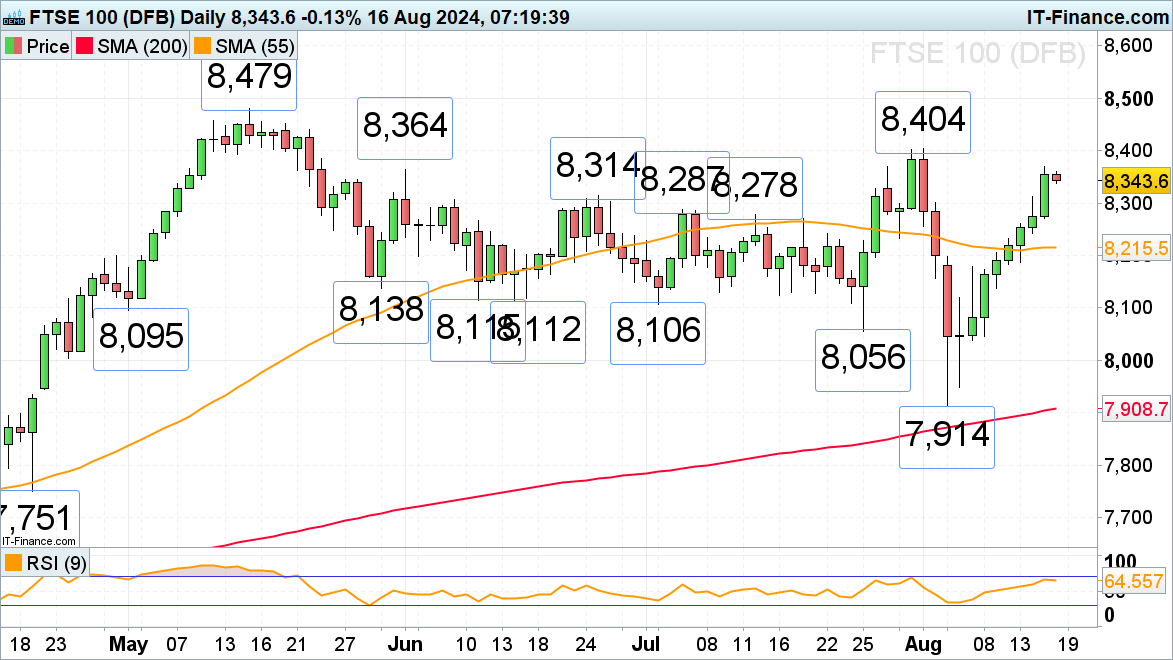
The FTSE 100 has seen eight straight days of gains as rate cut expectations on both sides of the Atlantic remain firmly entrenched. The late July and early August high at 8,404 is being eyed, now that the 8,278-to-8,314 late June to mid-July highs have been bettered.
Minor support below Wednesday’s high at 8,313 can be seen along the 55-day simple moving average (SMA) at 8,215.
FTSE 100 Daily Chart
| Change in | Longs | Shorts | OI |
| Daily | -4% | 2% | 1% |
| Weekly | 5% | -9% | -5% |
DAX 40 surges ahead
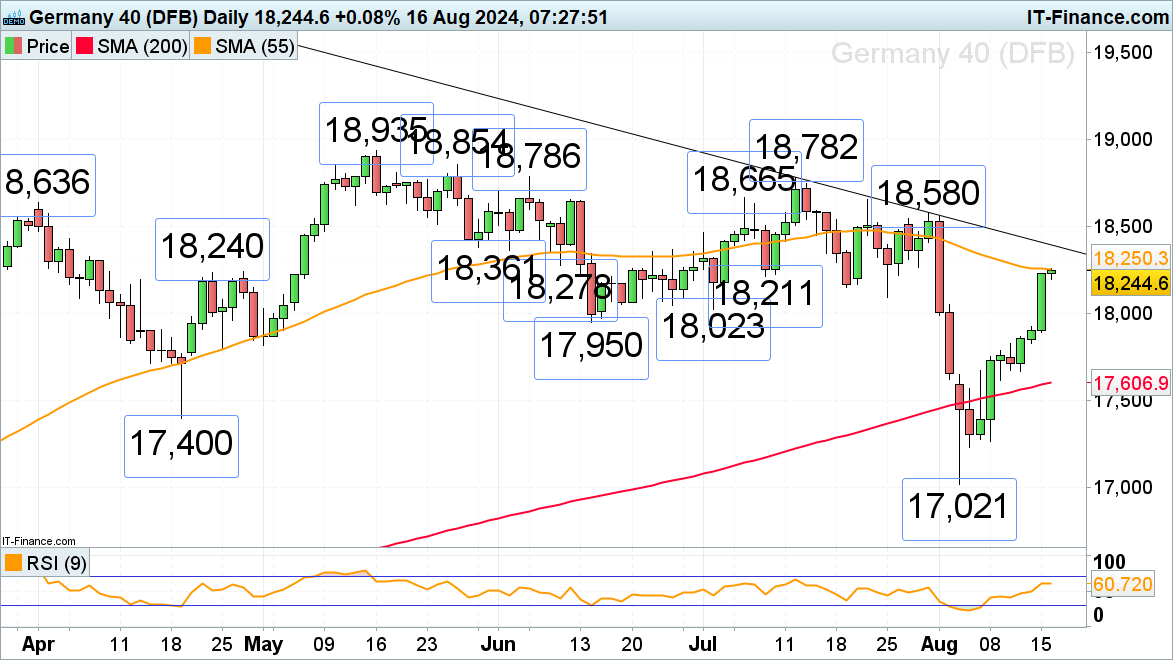
The DAX 40’s recovery from last week’s 17,021 low has accelerated to the upside, following solid US retail sales data which pushes recession fears aside. The 55-day simple moving average (SMA) at 18,250 acts as minor resistance but a rise above it would engage the July-to-August resistance line at 18,392. Further up sits the 18,580 pre-sell-off high.
Potential slips may find support between the 19 and 25 July lows at 18,149-to-18,095.
DAX 40 Daily Chart
Recommended by Axel Rudolph
Building Confidence in Trading
S&P 500 on track for a seventh straight day of gains
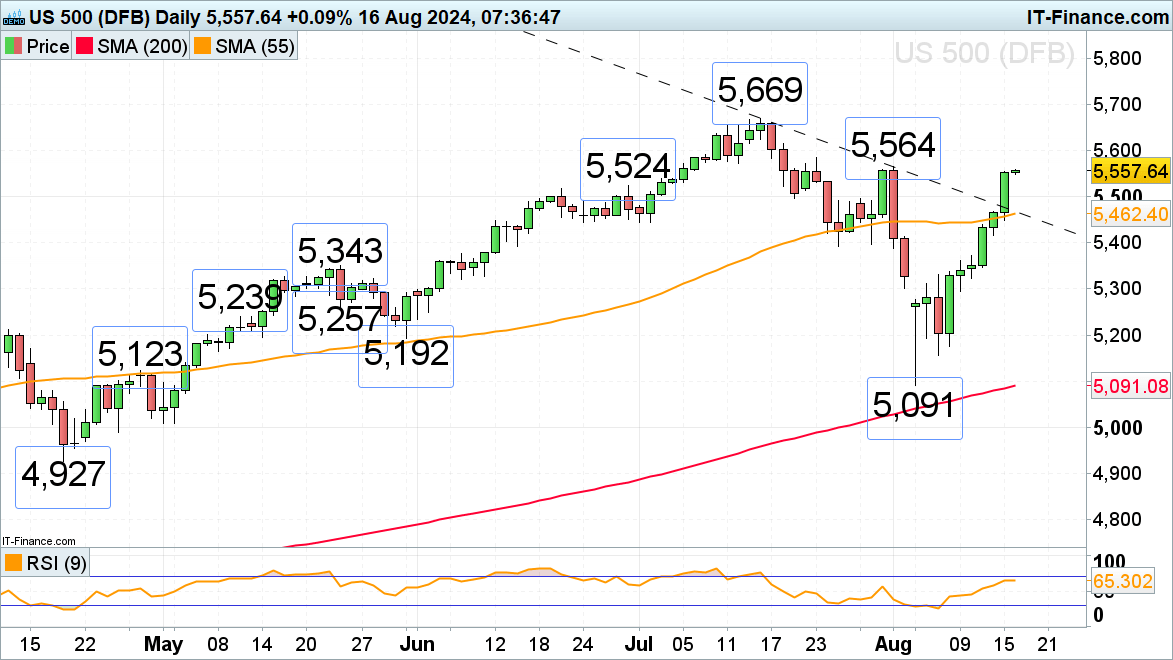
The S&P 500’s rally is gaining upside momentum and has reached the early August high at 5,564 around which it may short-term pause. If not, the July peak at 5,669 will be next in line.
The breached July-to-August downtrend line and 55-day simple moving average (SMA) at 5,469-to-5,462 are now expected to act as support, were they to be revisited.
S&P 500 Daily Chart


